01 / OPERATOR WORKFLOW
Capture a consistent snapshot
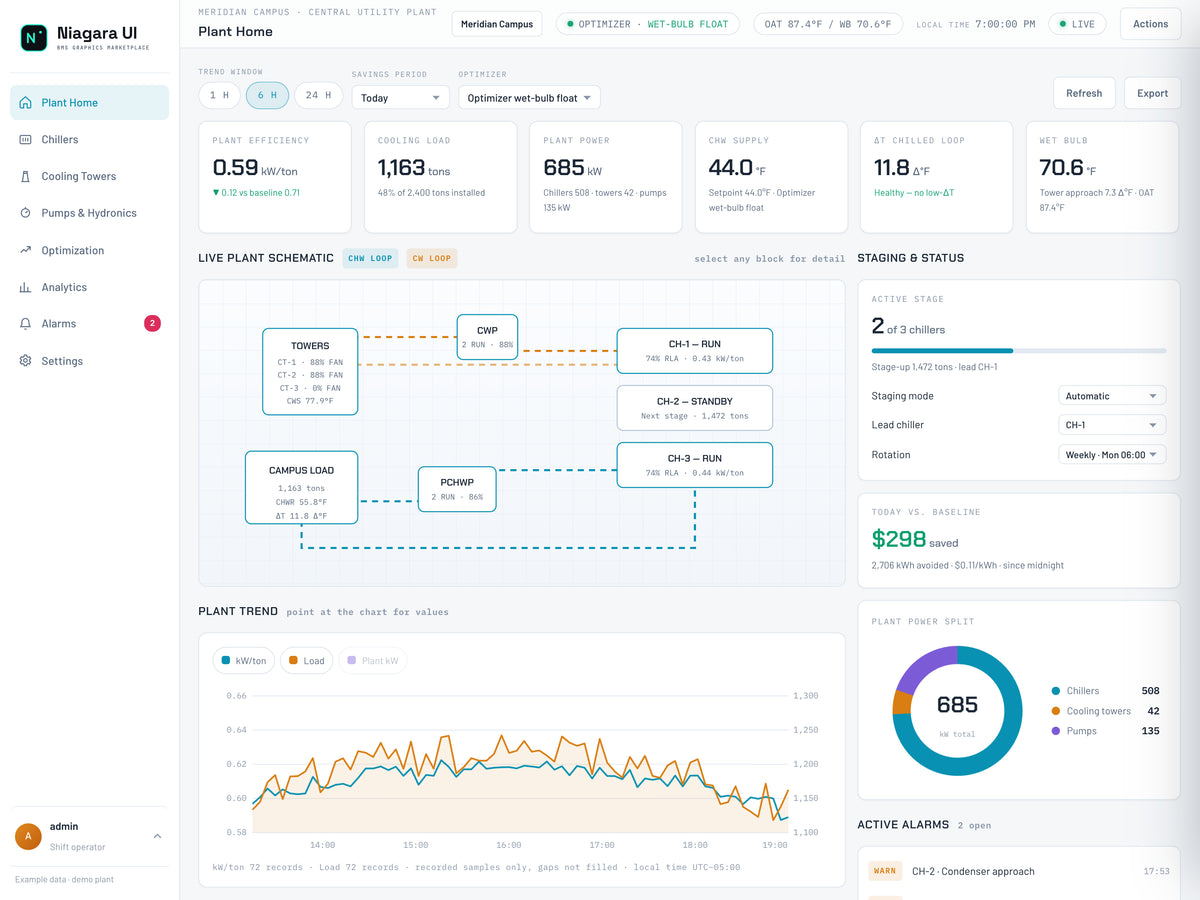
Record the selected plant, time, load and power split from Plant Home. The math 674 ÷ 1,145 gives approximately 0.589 kW/ton for this scenario.
NIAGARAUI / CHILLER PLANTS
A chiller's efficiency is one part of a plant's performance. THERMA brings cooling load, electrical power, hydronic conditions and equipment state together so the operator can examine what contributes to the whole-plant indicator.
APPLICATION SCENARIO / THERMA
Consider a plant producing 1,145 tons of cooling while drawing 674 kW: 500 kW for chillers, 41 kW for towers and 133 kW for pumps. Whole-plant efficiency is approximately 0.59 kW/ton. The scenario asks what contributes to that figure before anyone proposes an operating change.
Scenario snapshot. Figures describe the scenario setup. Live readings and available actions depend on the project's configured sources.
01 / OPERATOR WORKFLOW
Record the selected plant, time, load and power split from Plant Home. The math 674 ÷ 1,145 gives approximately 0.589 kW/ton for this scenario.
02 / OPERATOR WORKFLOW
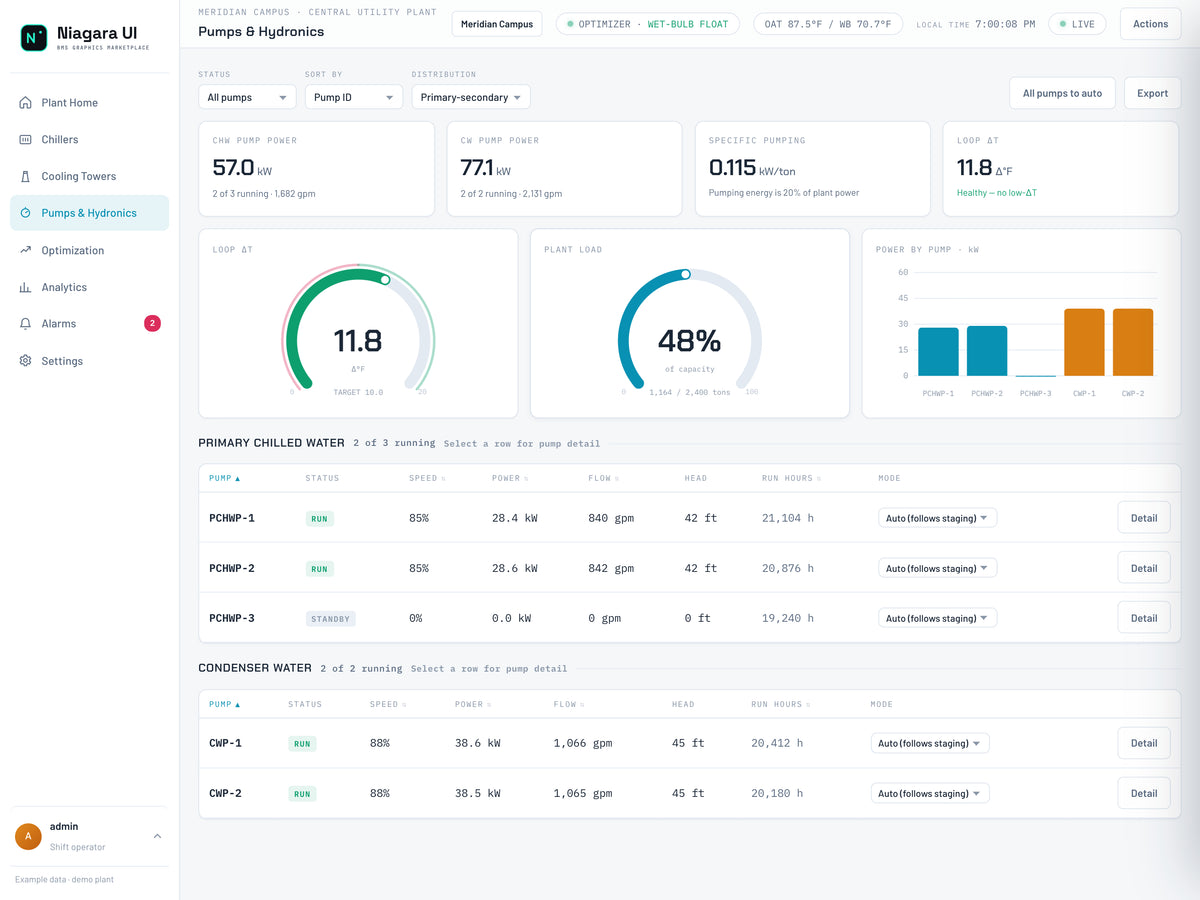
Compare the 500 kW chiller contribution with the 174 kW from towers and pumps. A chiller-only efficiency number therefore answers a different question from whole-plant kW/ton.
03 / OPERATOR WORKFLOW
Review the mapped water temperatures, flow, pump state and available hydronic trends. Check units and source coverage; a single delta-T value does not establish the cause of an efficiency concern.
04 / OPERATOR WORKFLOW
Use Analytics and the relevant alarm records across the same load and time context. Review optimization inputs and mapped requests under the site's existing controls and permissions, without assuming the graphics supply a control sequence.
The operator can explain how the plant indicator is formed, identify the measurements that need further review and retain a reproducible operating snapshot. This scenario does not establish an energy-saving result.
Analytics, recorded plant trends and available export controls support plant review. Baseline, cost or avoided-energy displays depend on configured inputs and are not independent savings verification.