01 / OPERATOR WORKFLOW
Establish the active site
Confirm the selected site and the freshness of the overview sources. Read PUE with IT and facility-power coverage; a comparison is useful only when the inputs and time basis match.
NIAGARAUI / DATA CENTERS
Data center operators need to move between facility indicators and the systems behind them. NODE and MESH approach that task with different page structures. Choose around the investigation workflow, the available data and the people who will use the station.
APPLICATION SCENARIO / NODE
Consider a data center overview showing a PUE indicator of 1.313, an IT load of 2.86 MW, a cooling load of 805 tons and four outstanding alarms. The operator's task is to understand the sources and system conditions behind that snapshot, rather than rank the facility from one number.
Scenario snapshot. Figures describe the scenario setup. Live readings and available actions depend on the project's configured sources.
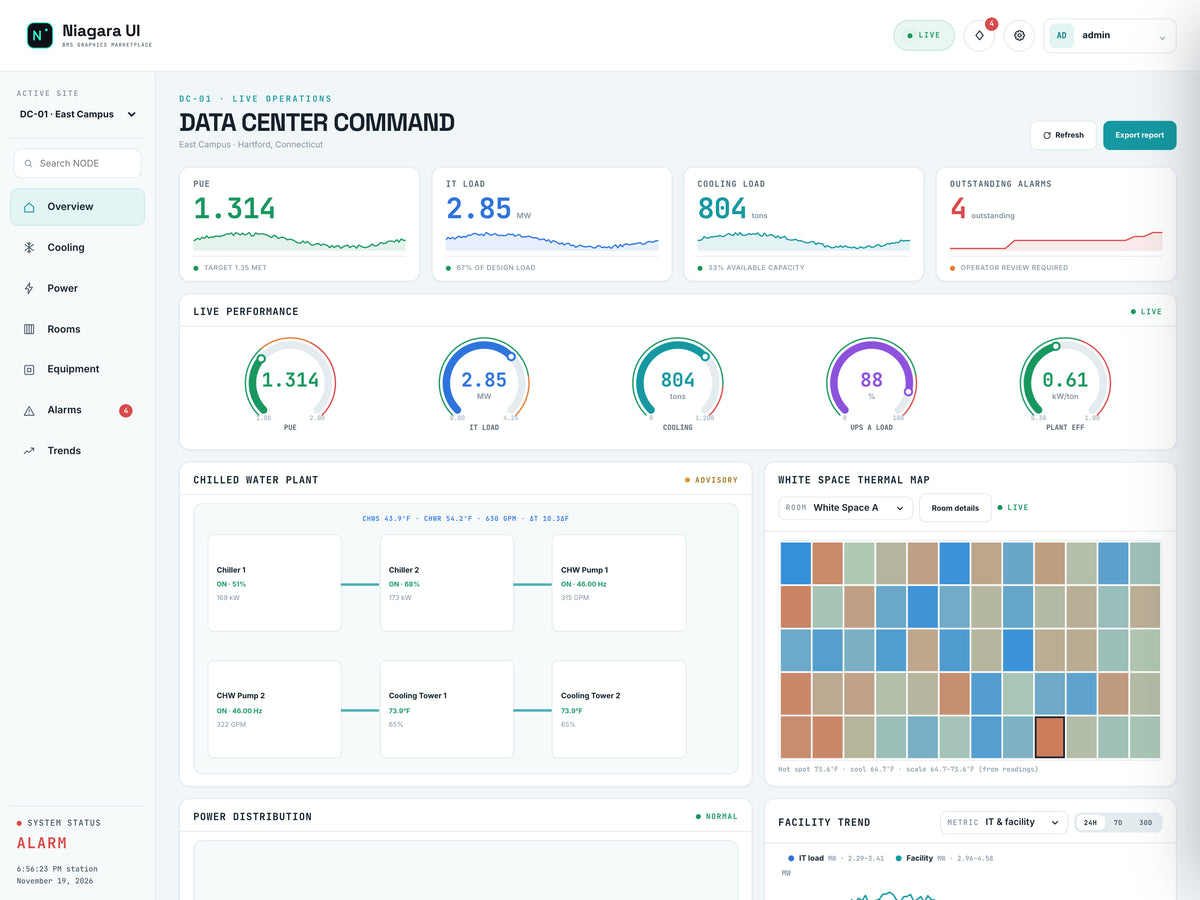
01 / OPERATOR WORKFLOW
Confirm the selected site and the freshness of the overview sources. Read PUE with IT and facility-power coverage; a comparison is useful only when the inputs and time basis match.
02 / OPERATOR WORKFLOW
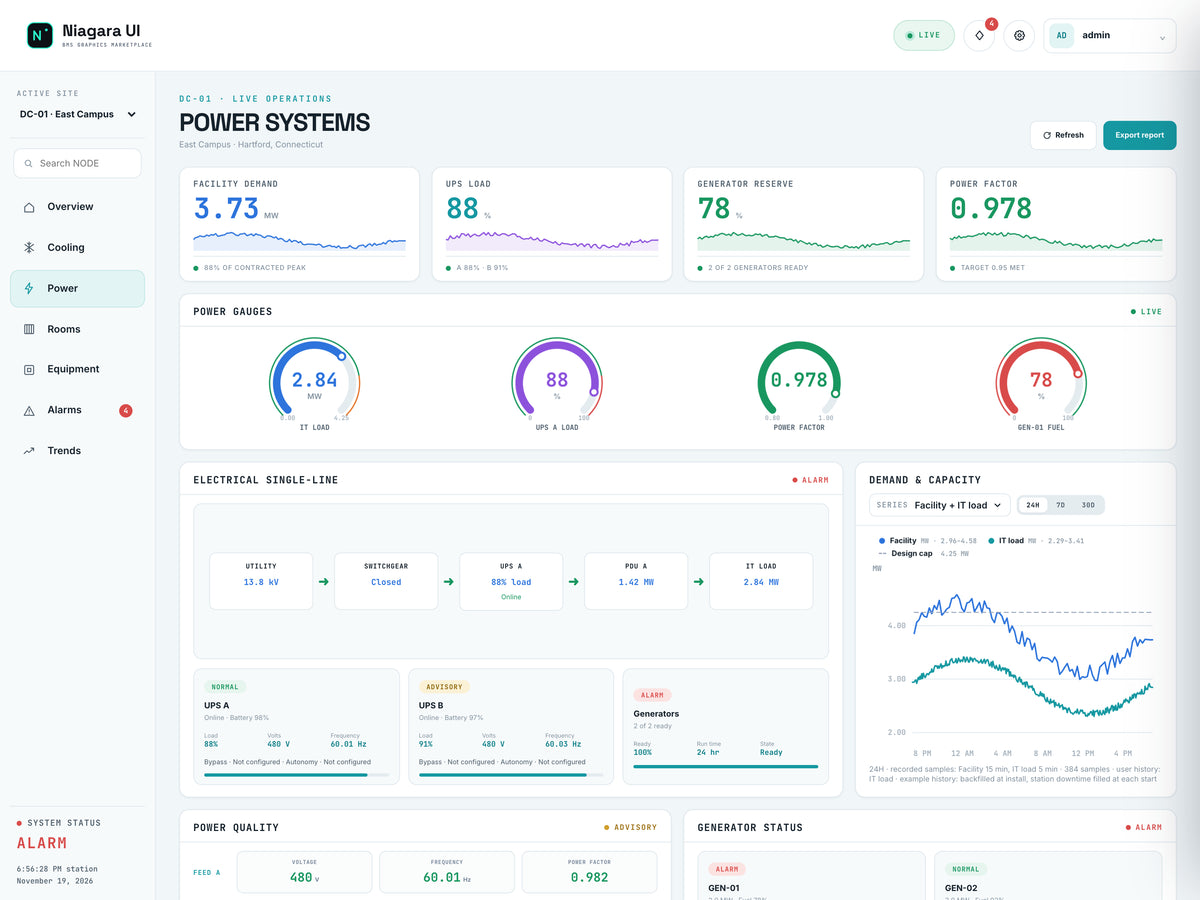
Use Power for electrical distribution and load context, then Cooling for the associated plant and equipment conditions. Read water temperatures and operating state with the same source interval.
03 / OPERATOR WORKFLOW
Use Rooms and Equipment to move from a facility indicator to a scoped view. Thermal context and equipment records help define the next check without proving a failure mechanism by themselves.
04 / OPERATOR WORKFLOW
Open the relevant alarm records and compare the available recorded histories. Retain the selected site, time range, units and observations in the applicable report/export workflow.
The operator can connect a headline indicator with a site, system, room and equipment review, then record the evidence supporting the next verification.
Overview report/export controls and the Trends page support the available data-review workflow. NODE does not include a separate Reports PX page; required report providers, histories and permissions remain project-specific.
APPLICATION SCENARIO / MESH
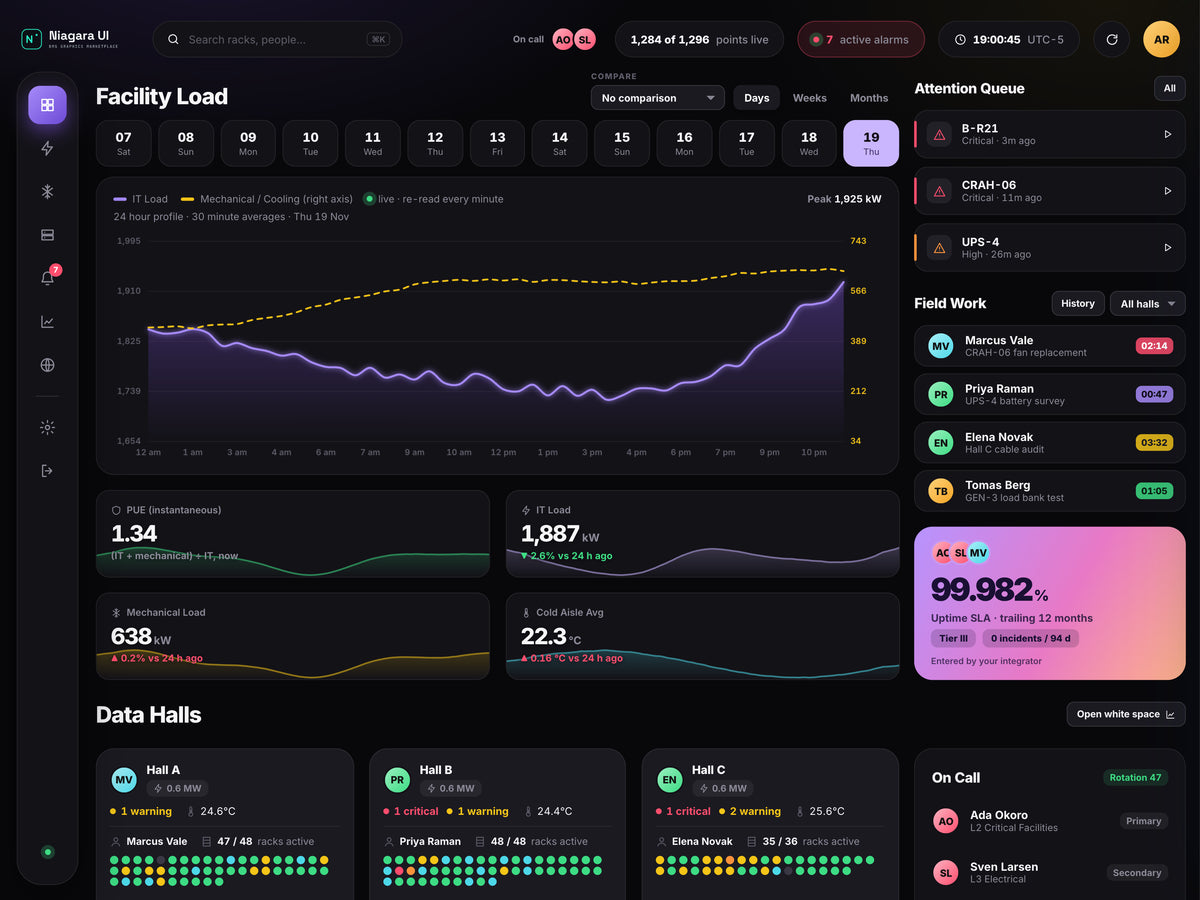
Consider a facility snapshot with 1,842 kW of IT load, 598 kW of mechanical load and a 22.4°C average cold-aisle temperature. Seven active alarms accompany an attention queue. A facility average alone cannot identify which hall, rack or supporting system needs review.
Scenario snapshot. Figures describe the scenario setup. Live readings and available actions depend on the project's configured sources.
01 / OPERATOR WORKFLOW
Start with Overview and confirm the facility, time window and source coverage. Use the attention queue to select a specific concern rather than treating the average cold-aisle value as every rack's condition.
02 / OPERATOR WORKFLOW
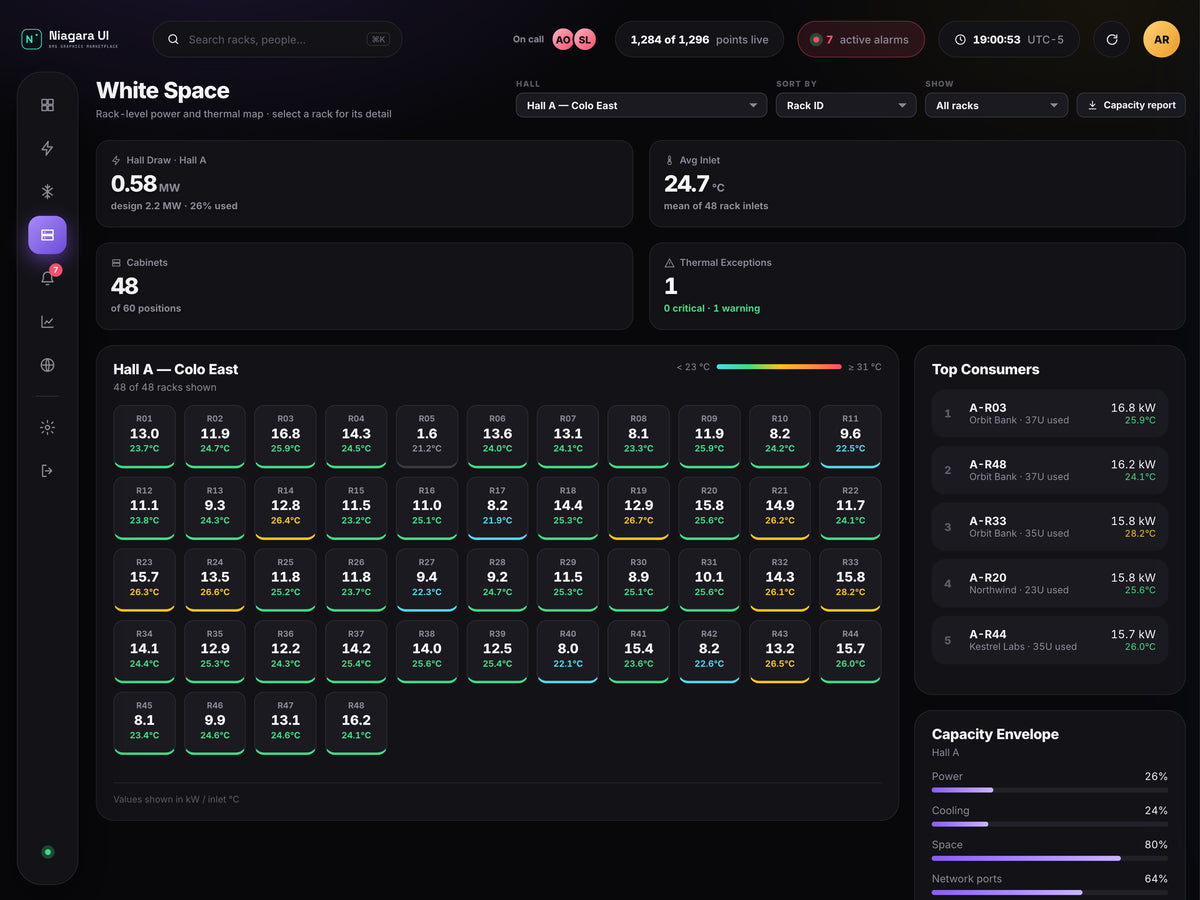
Follow the selected hall/rack context into White Space and inspect the supporting cooling information. Record which actual sources, sensors and equipment relationships support the displayed map.
03 / OPERATOR WORKFLOW
Use Power Chain to review the configured electrical relationships and available condition/load data. A drawn chain does not verify electrical topology or establish redundancy certification.
04 / OPERATOR WORKFLOW
Review Alarm Console and Trends & Histories for the scoped event. Drivers / Networks and Station Config provide station-oriented context where the user's configured access permits it.
The review can end with a hall/rack/system evidence trail and an actionable handoff, while preserving the distinction between live source readings and integrator-entered context.
Trends & Histories and Alarm Console support recorded operational review. MESH has no separate Reports PX page. Station and network views require the actual Niagara resources and appropriate access.