Hands-on dashboard tutorial · NODE · About 25 minutes
A datacenter dashboard places several important numbers side by side: facility demand, IT load, PUE, UPS loading, and cooling conditions. They describe related parts of the operation, but they are not interchangeable. This tutorial shows how to use NODE to understand the relationship between facility and IT power, follow the electrical view, and review a trend without turning a single number into an unsupported conclusion.
Your outcome: a documented power review with a checked PUE indicator, a clear measurement boundary, and a sensible next verification. You will not operate electrical equipment, acknowledge alarms, or change control settings.
Before you begin
Open the NODE browser demo. Select DC01 East Campus in Active Site, then open Overview. The demo uses simulated readings that can change as you navigate. Your numbers may differ from the example calculations.
For an installed project, identify where facility power and IT power are measured, how histories are collected, and which equipment each meter includes. Verify the site's approved electrical documentation and operating procedures. The dashboard is a visual information layer; a graphic or capacity label does not replace an engineering assessment.
1. Read the Overview as a connected set of indicators
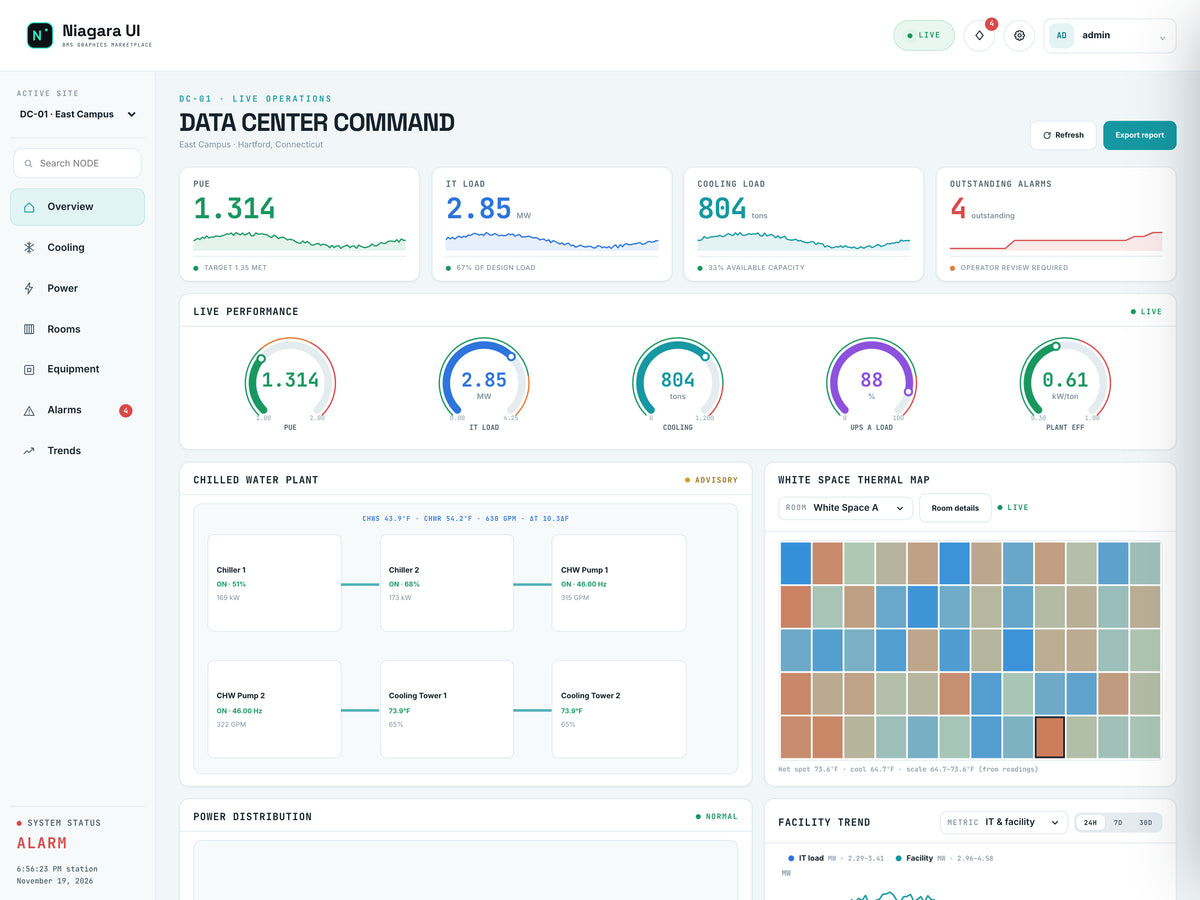
Read this screen
- PUE contextRecord the active site, PUE indicator and IT load, then confirm which sources support the calculation.
- Associated conditionsKeep cooling load and outstanding alarms as context for the same operating interval.
- Record the displayed PUE and its target.
- Record IT Load, including its unit.
- Note cooling load and the active alarm count.
- Review the power distribution graphic to understand the displayed path from utility through distribution equipment to IT load.
- Record the selected site and observation time alongside the readings.
The example site can show a PUE near 1.31 against a target of 1.35. That target belongs to the demonstration; it is not a universal requirement. A reading below the target also does not prove that cooling conditions, electrical resilience, or every individual rack is satisfactory. Those require their own evidence.
2. Understand what PUE is measuring
Power Usage Effectiveness = total facility energy ÷ IT equipment energy for a defined period and consistent boundary. A dashboard may also display an instantaneous power-ratio indicator using facility kW or MW divided by simultaneous IT kW or MW.
These two views are related but not identical. An instantaneous ratio helps you understand the current operating condition. A reporting-period PUE requires the corresponding energy totals over that same period. Do not label a momentary ratio as monthly or annual performance.
Use identical units in the numerator and denominator. For example, convert 3.75 MW to 3,750 kW before dividing by an IT reading expressed in kW. Dividing MW directly by kW produces a result off by a factor of 1,000.
3. Open Power and check the math
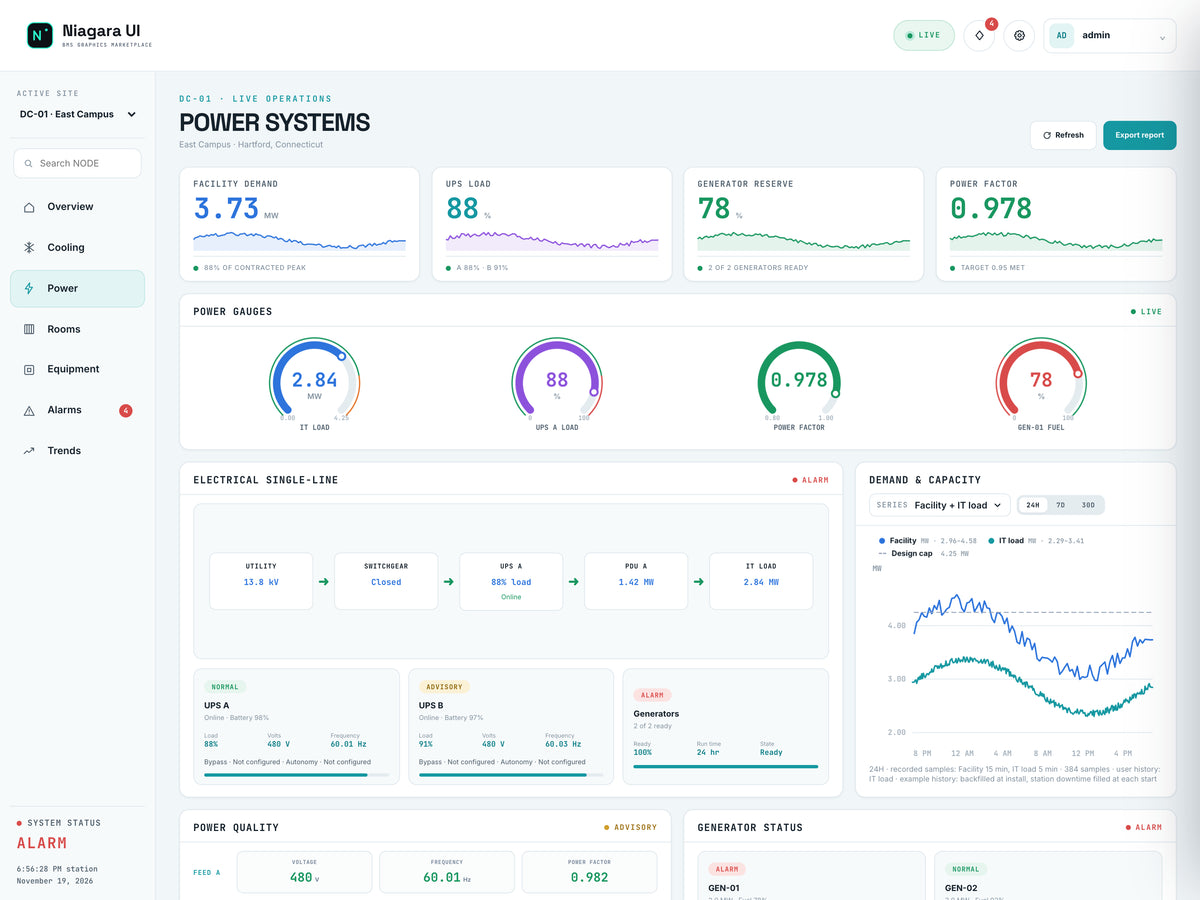
Read this screen
- Numerator and denominatorUse the mapped facility power and IT power from a consistent scope and time basis.
- Electrical pathInspect the selected distribution context and capacity readings before identifying the next equipment check.
- Select Power in NODE's navigation.
- Read the Facility Demand card.
- Locate the IT load value in the electrical single-line view.
- Capture both values as close together as possible, with their units.
- Calculate facility power divided by IT power.
Worked example: Facility Demand of 3.75 MW divided by IT Load of 2.86 MW gives approximately 1.311. The corresponding difference is 3.75 − 2.86 = 0.89 MW. Within a valid common measurement boundary, that difference represents the non-IT portion included in facility power; it should not automatically be labelled “cooling power.” It may include cooling, distribution losses, lighting, and other included loads.
If the displayed PUE and your calculation differ slightly, check timestamps and rounding. If they differ substantially, check meter boundaries and point quality. Use the Facility Demand measurement rather than assuming that a similarly sized PDU value represents the entire facility. The label and metering location matter as much as the number.
4. Read electrical capacity without over-interpreting it
The Power page includes UPS Load, Generator Reserve, and Power Factor indicators, along with UPS cards and the electrical single-line. Review them as separate measurements. A UPS load percentage describes loading relative to the configured capacity basis. Generator reserve describes a different part of the system. Power factor describes the relationship between real and apparent power; it is not the same quantity as PUE.
The demo may display an “N+1 capacity available” label. Treat this as demonstration status, not proof that a real site can tolerate every failure or maintenance scenario. Actual resilience depends on topology, equipment ratings, load distribution, protection, availability, and the approved operating scenario.
For a useful review, record both the value and its basis: percentage of what capacity, on which feed, at what time? If that basis is unclear, make meter or configuration verification the next action instead of drawing a capacity conclusion.
5. Compare demand and PUE over time
On Power, use Demand & Capacity. Start with Both feeds, then use the feed selector to inspect Feed A or Feed B when that distinction is relevant. Keep track of the selected scope: a single-feed series should not be compared directly with a whole-site total as if both represent the same boundary.
Use the available 24H, 7D, and 30D controls to compare a daily pattern with a longer period. Return to Overview and use the Facility Trend metric selector to review IT & facility and PUE vs target. Look for whether a ratio change coincides with an IT-load change rather than assuming the supporting infrastructure changed.
Illustrative comparison: if non-IT power stays at 0.90 MW while IT load falls from 3.00 MW to 2.00 MW, the power ratio rises from 3.90 ÷ 3.00 = 1.30 to 2.90 ÷ 2.00 = 1.45. Total facility power has fallen, yet the ratio has increased. This is why a higher PUE indicator does not necessarily mean total electricity use increased.
6. Relate the review to alarms and cooling context
Return to the Overview and review active alarms and the thermal information. Record the equipment identity, severity, and event time for any relevant item. A communications warning can affect confidence in a displayed point; a cooling alarm requires its own investigation even when the power ratio looks favorable.
Do not acknowledge an alarm merely to make a dashboard counter smaller. Follow the site's response procedure, and distinguish acknowledgement from resolution. For this exercise, noting the relevant item and identifying the next verification is sufficient.
Completion checklist
- Correct site and time window recorded.
- Facility and IT readings captured with matching units and boundaries.
- Instantaneous power ratio distinguished from period-energy PUE.
- Non-IT power distinguished from cooling power alone.
- Feed scope and capacity basis noted.
- Trend interpretation checked against changes in IT load.
- Relevant alarms or data-quality questions included in the handoff.
Explore the NODE dashboard package or request a live demonstration. Public packages are available on Software Downloads; a license is required to run the dashboard on your host.