Hands-on dashboard tutorial · LUMA · About 20 minutes
A warm-room complaint rarely starts with a complete equipment diagnosis. It usually starts with a location, a time, and someone saying that the space feels wrong. This tutorial shows how to use LUMA to turn that report into a focused investigation: establish the building context, narrow the search to a floor, compare individual zones, and record evidence before anyone changes a control setting.
Your outcome: a short, defensible comfort investigation that identifies the affected zone and the next point or condition to verify. You do not need to change a setpoint to complete the exercise.
Before you begin
Open the LUMA browser demo in another tab. The demo contains simulated properties and readings; values can change while you work. Use the names and navigation below to follow along, rather than expecting every number to match. On an installed project, available points, histories, permissions, and control actions depend on the project configuration.
Keep a simple note with five fields: property, floor and zone, time of complaint, observed condition, and next verification. For a real complaint, record whether the room was occupied and how long the issue lasted. A snapshot taken after everyone leaves may tell a different story from the occupied period.
1. Establish the building context in Command
- Use Active Property to select Meridian Tower.
- Open Command. Review the Comfort Index, people on site, indoor air quality, and the operator focus items.
- Record the displayed units. This exercise uses degrees Fahrenheit; keep all comparisons in the same units.
- Note any relevant alarm or unusual building-wide condition before drilling down.
The building summary helps you decide whether you are looking for a local exception or a broader pattern. A strong building-wide Comfort Index does not prove that every desk is comfortable. An average can look healthy while a perimeter zone has a persistent afternoon problem. Equally, a single complaint does not establish that the whole air-handling system is failing.
2. Use Floors to find the right comparison
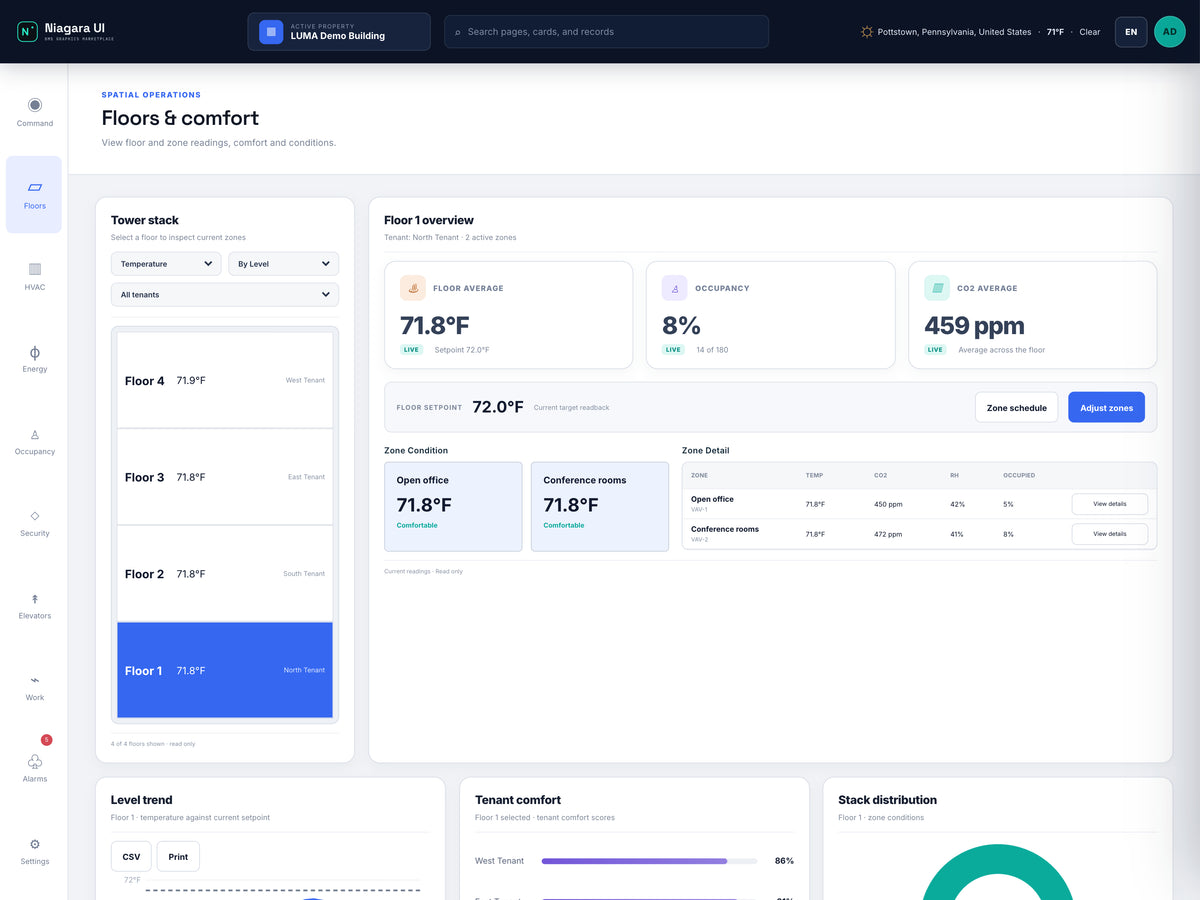
Read this screen
- Selected floorConfirm Level 21 is selected before comparing the floor summary with the Zone Detail table.
- Comparison scopeKeep the tenant filter and sort order in view; a filter can hide a useful neighboring zone.
- Open Floors to reach Floors & comfort.
- In the tower stack, begin with the Temperature metric and By level ordering.
- Select Level 21. Confirm that the selected floor details have changed before reading its values.
- Compare the floor average with its setpoint, occupancy, and CO₂ summary.
- Use Warmest first when investigating a warm-floor pattern. Return to By level when you need to relate a result to its physical location.
Sorting answers a different question from filtering. Warmest first helps identify relative temperature outliers; a tenant filter narrows the set of spaces under review. Start with all tenants so that a filter does not hide useful neighboring comparisons. Then narrow the view if your investigation is specific to one tenant.
3. Move from the floor average to the zone evidence
On Level 21, compare the zone condition grid and the Zone Detail table. The demo includes spaces such as North open office, East perimeter, West offices, South studio, and Boardroom. The table brings temperature, setpoint, CO₂, relative humidity, damper position, airflow, and occupancy together.
Work across a row before comparing rows. For the affected zone, record its temperature and setpoint first. Then add occupancy and airflow. Finally compare it with a neighboring zone serving a similar use. A boardroom occupied by a group is not necessarily a fair comparison with an empty open office.
Worked example: if a zone reads 71.9°F against a 72.0°F setpoint, the difference is 71.9 − 72.0 = −0.1°F. That snapshot alone does not support a claim that the zone is currently overheating. It also does not invalidate an earlier complaint: the issue may have occurred during a different occupancy or solar-load period.
4. Read airflow and air quality in context
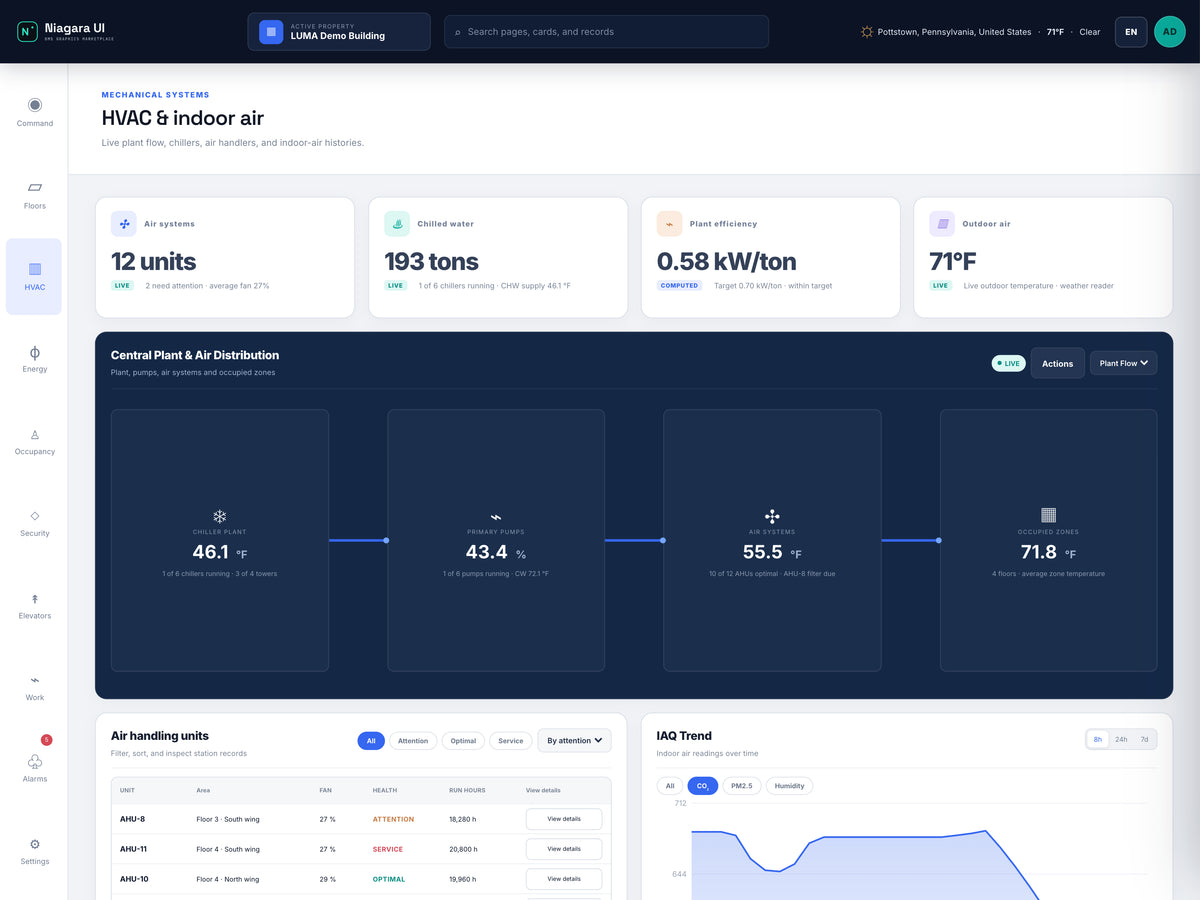
Read this screen
- Airflow and damperRead the label and units of the mapped source. Damper position is not a measurement of delivered airflow.
- Time and qualityCompare air-quality and occupancy context over the complaint interval before inferring a cause.
A damper percentage is a command or position indication, not a direct measurement of delivered comfort. A partly open damper can be appropriate at low load. Conversely, a high damper indication does not prove that the required airflow is reaching the room. Compare airflow with the project's design and sequence, and verify the meaning and quality of the bound points.
CO₂ and occupancy provide context for ventilation review. The demo displays its own CO₂ target; that is not a universal compliance threshold. Evaluate a real installation against its approved ventilation design and applicable requirements. A low CO₂ reading also does not establish that all indoor-air-quality conditions are acceptable.
5. Check whether the pattern persists
Review the selected floor's temperature-versus-setpoint trend. Ask whether the deviation is sustained, whether it appears around occupancy changes, and whether the displayed history actually covers the complaint period. A floor trend describes the floor-level signal; it should not be presented as proof of an individual zone's behavior.
If the trend and current snapshot disagree, preserve both observations. In a live project, verify timestamps, point status, sensor location, and the history interval before making a diagnosis. If the required zone history is not configured, record that gap for the integrator instead of filling it with an assumption.
Common mistakes to avoid
- Changing a setpoint before checking context: this can obscure the original condition. Follow the site's authorization and operating procedure for any adjustment.
- Comparing different time periods: a current occupancy value and yesterday's temperature event are not simultaneous evidence.
- Treating a colored tile as a diagnosis: the underlying points and thresholds still need verification.
- Confusing percent occupancy with a people count: record the label and unit alongside the value.
Finish with an actionable handoff
Use this format: “Meridian Tower, Level 21, North open office; complaint at [time]; current temperature [value] versus setpoint [value]; occupancy [value]; airflow [value]; comparison zone [name]; trend period [range]. Next check: [specific sensor, schedule, airflow requirement, or equipment relationship].” This gives the next person a reproducible starting point.
- Correct property, floor, and zone confirmed.
- Temperature and setpoint recorded with units and time.
- Occupancy, airflow, and air-quality context reviewed.
- Trend coverage distinguished from a single snapshot.
- One next verification identified without an unsupported diagnosis.
Explore the LUMA dashboard package, get your package from Software Downloads, or contact support for help with your project. Downloads are public; a license is required to run the dashboard on your host.